CRAB and MIT Sea Grant Chart of the Charles River
Sediment deposition has been a long standing problem in the Charles River. It was recently highlighted in an article published in the Boston Globe in 2011 and seems to be a larger problem where major tributaries empty into the Charles: Laundry Brook, Hyde Brook, Faneuil Brook, Muddy River and Stony Brook. Once the sediment is in the river, it can spread to other areas, causing further problems especially in the upper stretch of the Lower Charles where the water depth is already shallow. While this seems to be a bigger concern for users of the upper stretches of the river, several years ago a significant bar up-river of the Massachusetts Avenue Bridge was shallow enough and large enough to be a navigation hazard to both sailboats and motorboats. There are also the extraordinary events such as the water main breaks in Weston in May 2010 and near the Anderson Bridge in August 2015, both of which caused large amounts of sediment to be moved. In trying to remedy the sediment issues, it has been difficult to motivate various government agencies since the river is not used for commercial navigation and much of the knowledge about the shallows and bars has been anecdotal, coming from the daily experiences of the boaters on the river but not backed up by quantitative data.
To assist in resolving the problem of sediment deposition, the Charles River Alliance of Boaters (CRAB) has developed a partnership with the MIT Sea Grant College Program to create a chart of the river depth between Science Park and the Watertown Dam, and to monitor changes in the river bottom in the future. While this work is in the early stages, the MIT Sea Grant College has already mapped portions of the sailing basin and the Muddy River delta. Note the shallow area less than 2 feet deep in the chart of the Muddy River delta. Click an any of the three images to see a larger chart.


Moreover, the MIT Sea Grant College has done a lower resolution survey of the river from the Massachusetts Avenue Bridge to the Newton Yacht Club. All of the depth charts measured so far can be found on an interactive map - zoom into the area near the River Street Bridge, click on the blue dot, and select "View" to load the depth data. This is a great start to this new partnership and we're very thankful for MIT's contribution to the users of the river. This survey is probably the first time such a measurement has been done of the upper reaches of the Lower Charles since 1902 [1, 2, 3, 4], although more recent surveys have been done of select areas below the BU Bridge [5, ]6.
The data measured by the MIT Sea Grant College is preliminary and should be taken as such and not used for navigational purposes. Note that the data inside the Esplanade lagoon was not measured by the MIT Sea Grant College and may not be accurate. The goal in this project is to survey the depth of the Charles and to identify areas which may be a hazard to safe boating and areas which may need further monitoring and remediation. The initial scope of the project is described below:
- Measurement of Depth: Inexpensive fish-finders can be used to record the depth and GPS position. Examples of this from Lowrance can be found here and here. These models have a micro-SD card that records all that data which can then be uploaded onto a computer. There may also be a model with built-in Wi-Fi to transfer the data.
- Passive and Targeted Data Measurements: The easiest way to get data is to deploy these sensors on boats as they are moving about the river during their normal activities. The sonar probe can be easily mounted on the transom near the motor. By using a few no-wake crew coaching boats, we can probably cover most of the length of the river where rowing crews are practicing and racing. If we were also to outfit the Charles River Clean Up boat, we could get data from the shoreline as well. That probably means that we would want to have a few fish-finders. While most of the data collection can be done passively by volunteers from CRAB member boathouses, yacht clubs, and the Clean Up Boat during their normal routine of being on the water, there will be a need to measure targeted areas not covered by such routine activity excursions and where more detailed data is needed.
- Development of Digital Charts: Our goal is to develop charts that can be available on-line and in printable format, as well as files for navigation instruments. Initially, we explored Insight Genesis, where data could be added to a global map. After uploading, the data gets reviewed and then posted to an online map. Each small blue dot represents an area that has been mapped. You'll notice that quite a few lakes in Massachusetts, as well as the Charles River above the Watertown Dam has already been measured by someone.
-
Influence of Daily Water Releases:
As part of flood control measures, water from the river is released into Boston Harbor at low tide and held in the river at high tide, slowly accumulating.
This causes the water level in the river to change over several
inches during the course of a day.
On the lower basin, there are two gauges measuring the water height, at the
New Charles River Dam,
just down-river of the Zakim Bridge, and at the First Street Bridge,
at the entrance of Broad Canal, the canal leading to the Cambridge location of Charles River Canoe & Kayak.
Depths on marine charts are typically referenced to something called the mean low water level, which for US ocean charts is the 19-year average of low tide levels. This provides for a margin of safety since the charts indicate the shallowest depth of water one might expect, except at times of extreme low fluctuation. While the gauge station at First Street is a good indicator of the water level in the lower basin, we do not fully understand how the water level is changing further up-river, far from the gauge stations. It would be useful to quantify this relationship, both in terms of the average change in height and any temporal difference when the high and low points occur. We plan to install additional stream gauges to quantify the daily and seasonal variation. - Leadership and Technical Contribution: In order to sustain this effort, it is important to have some one in charge of the project, to oversee things and to review the data to ensure its integrity. This is true for generating the initial chart of depths and especially if we want to measure data in the future to see how things might be changing over time. Whether this is someone at the MIT Sea Grant College or someone within CRAB or another river stewardship organization, it will require some financial support. This will be a subject of conversation of the coming winter.
Initial Steps:
The MIT Sea Grant College is conducting measurements in the lower basin to refine how best to do the measurements. They are using both human-driven boats and an autonomous robotic 16-foot catamaran, outfitted with instrumentation to measure and record data along a pre-programmed course. If you see this autonomous vessel, or smaller autonomous kayaks used by another group at MIT, please give it a wide berth with minimal wake. The nice thing about the autonomous vessels is that they move in straight well-defined lines without becoming bored or tired for hours at a time, gathering data the whole time. the MIT Sea Grant College is also exploring software options to deliver the data to the users via Google Earth, Google Maps, printable PDFs, and uploads to common navigation instruments.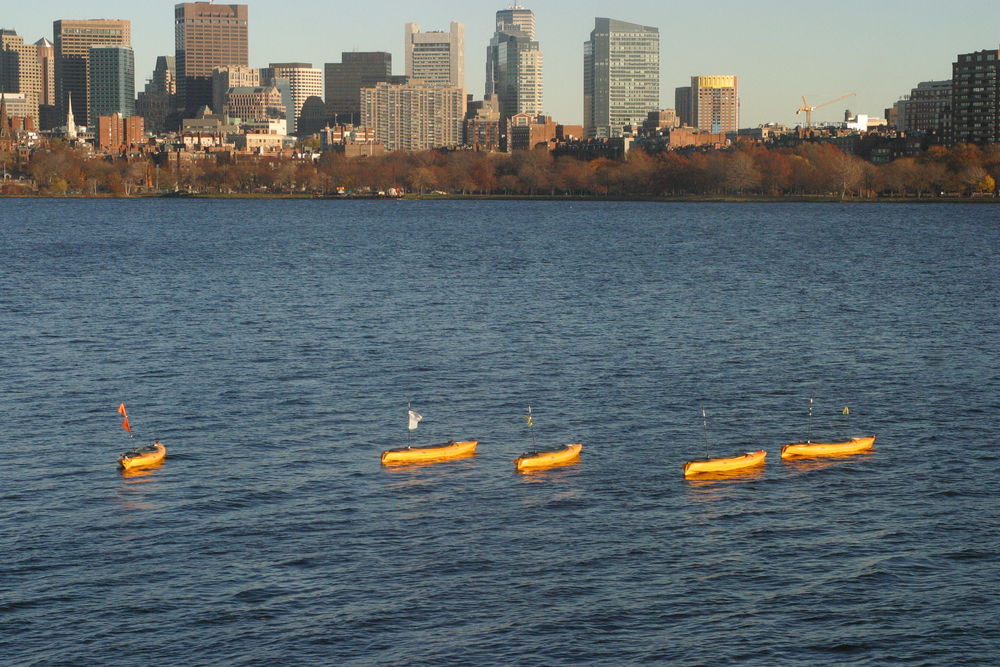
Spring 2016:
While the MIT Sea Grant College will continue to make measurements, CRAB can contribute to the project by taking measurements above the Mass Ave Bridge, especially above the BU Bridge, as you travel up and down the river doing your normal activities. The concept here is to have a few fish-finders that can be simply and temporarily installed on boats, record data while they are traveling along the river, and then upload the data to a central repository so it can be shared with everyone. By collecting data in finer detail, we will be able to better determine any changes in the bathymetry of the river bottom. If everyone pitches in their little bit, we can have the entire river mapped out in fine detail in short order. If you are interested in participating, please contact for more information.Financial Support:
As mentioned above, to complete this project and ensure operation in future years, to develop comparative data over time, we will need funds to obtain the fish-finders, stream gauges, and to support the personnel providing the technical leadership and oversight. If you would like to contribute to this project, financially or otherwise, please send your checques to:Dave Amicangioli
CRAB Treasurer
25 C Street
Belmont, MA 02478
Thanks in advance for your support!!!
References:
[1] Plan of the Charles River from the Waltham line to Boston Harbor, 1894[2] Charles River Basin Contour Map of Upper Basin, 1902, Watertown Dam to nearly Arsenal Street
[3] Charles River Basin Contour Map of Lower Basin, 1902, Arsenal Street to River Street
[4] Charles River Basin Contour Map of Lower Basin, 1902, River Street to the Craigie Bridge, courtesy of Massachusetts Department of Conservation and Recreation
[5] Lower Charles River Basin, Navionics electronic chart
[6] Charles River Hydrographic Survey, CLE Engineering, Inc.